 Jacob Tomlinson
This week I’ve been working on some custom Sphinx extensions for a documentation site.
Sphinx is a pretty complex tool with a broad ecosystem so documentation tends to be spread across the upstream project, dependencies like docutils and popular extensions like MyST. Therefore figuring out what is going on can be challenging, so I almost always resort to digging through state in a debugger and doing code spelunking on GitHub.
I have a nice debugging workflow set up with VSCode that I wanted to share.
Build Tools
Almost all of the Sphinx sites I work on these days use at least one extension from the Executable Books Project. My favorite of these is sphinx-autobuild which replaces the regular make html build step.
This tool watches for changes to your files as you edit them and reruns the sphinx build to keep things up to date. It also injects a live reload script into the built HTML so that it can trigger your browser window to automatically refresh when you hit save.
$ sphinx-autobuild docs docs/_build/html
[sphinx-autobuild] > sphinx-build ./docs ./docs/_build/html
Running Sphinx v5.3.0
loading pickled environment... done
...
build succeeded.

The HTML pages are in build/html.
[I 230124 10:08:13 server:335] Serving on http://0.0.0.0:8000
[I 230124 10:08:13 handlers:62] Start watching changes
[I 230124 10:08:13 handlers:64] Start detecting changes
Extensions
When working on a Sphinx extension that is specific to your docs site it’s common to put it in a directory in your docs source and add that to the Python path in conf.py.
# conf.py
...

import os
import sys

sys.path.insert(0, os.path.abspath("../extensions"))

extensions = [
    ...,
    "my_awesome_extension",
]

...
$ tree extensions
extensions
└── my_awesome_extension.py
When working on my awesome extension I want to be able to set breakpoints in VSCode so that I can explore the state.
VSCode config
To hook the VSCode debugger into your docs build you can create a new launch profile in .vscode/launch.json which runs sphinx-autobuild. The sphinx-autobuild CLI is a Python entrypoint so it is effectively the same as running python -m sphinx_autobuild. VSCode has a launch profile for executing Python modules so we just need to configure VSCode to run the sphinx_autobuild module with the same arguments that we would set on the CLI.
Because Sphinx Autobuild is a Python module and it imports and calls methods from Sphinx to run the build, which in turn imports your extensions and calls setup(app) the VSCode debugger is aware of the whole call stack and can set set breakpoints and pause execution anywhere within that.
So sphinx-autobuild docs docs/_build/html becomes:
{
    "version": "0.2.0",
    "configurations": [
        {
            "name": "Sphinx Autobuild",
            "type": "python",
            "request": "launch",
            "module": "sphinx_autobuild",
            "args": [
                "docs",
                "docs/_build/html"
            ],
            "justMyCode": false
        }
    ]
}
This config tell VSCode to launch a python module via the debugger called sphinx_autobuild with the docs docs/_build/html arguments. I’ve also set justMyCode to false which means we can set breakpoints anywhere in sphinx, myst, etc which are installed in my site-packages.
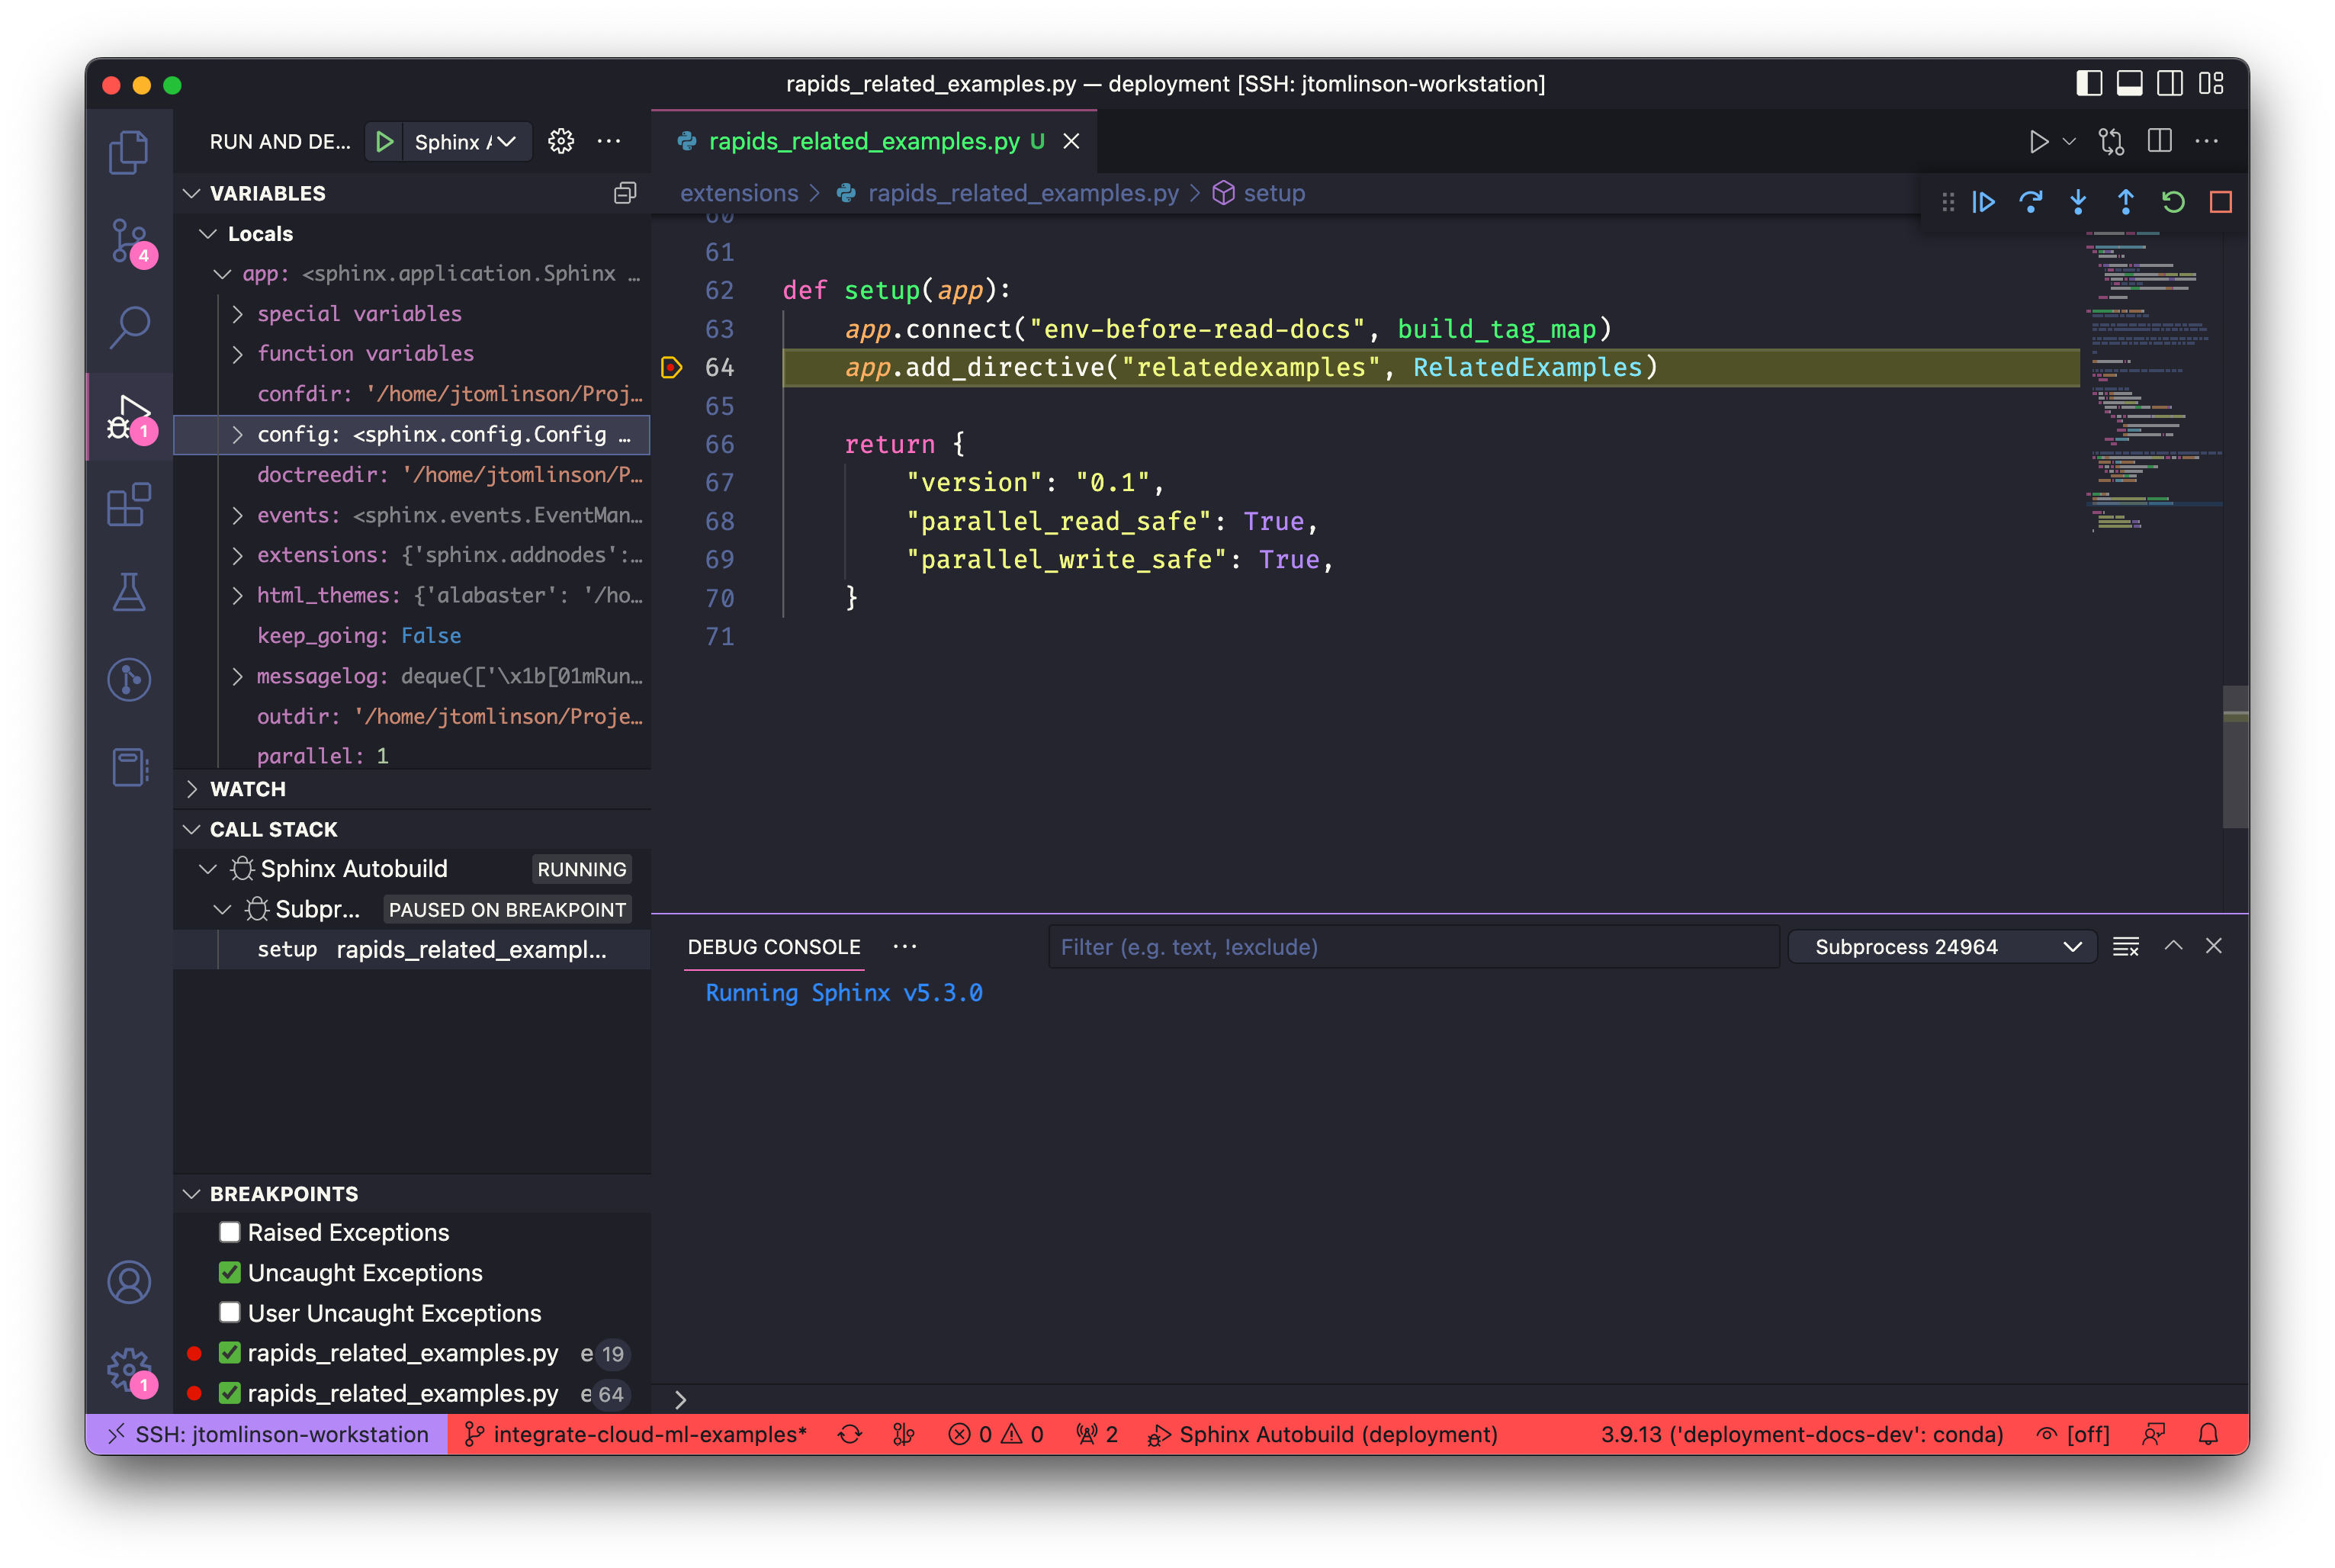
With this configuration I can set breakpoints in my extension and launch the whole build from the VSCode debugger.